

The same plan can last on a calm path and run out in a bad market.
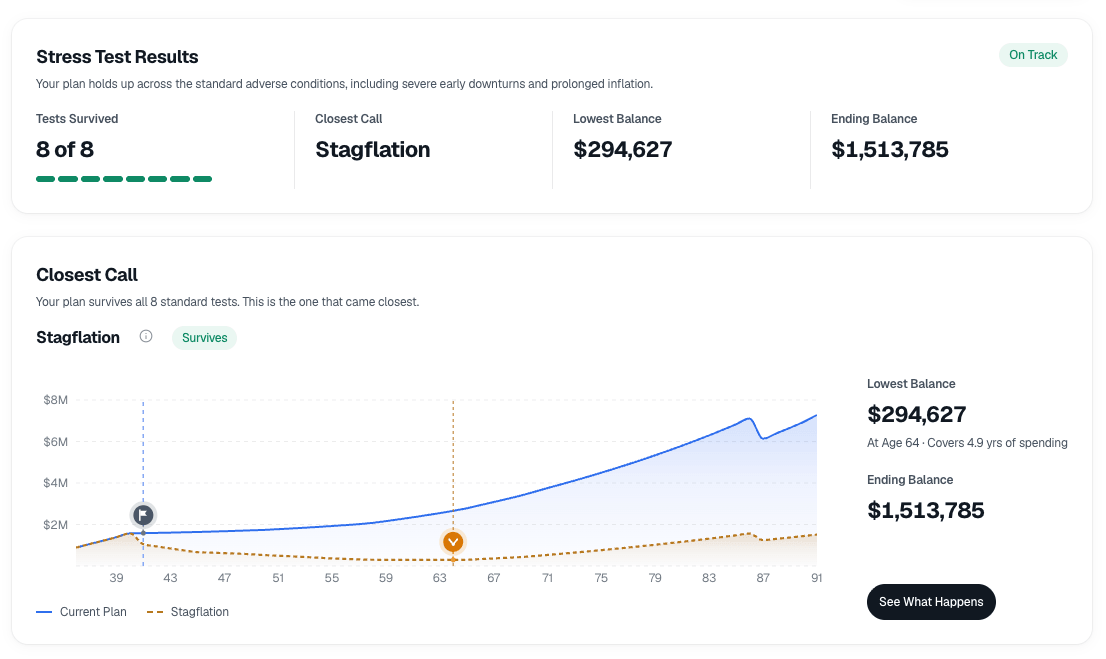
Chance of Success spreads returns at random. Stress Testing picks one bad market instead, such as a severe drop near the start of retirement, and runs that same plan through it.
You see two lines. One is the plan with no shock. The other is the plan under that test, including the age it runs out of money if it does.
01
What You Enter
The plan as it stands, and one named bad market.
02
What The Model Does
The calm path and the stressed path, drawn together.
03
What You Decide
Whether the stressed line lasts, and the age it reaches zero if it does not.
Explorer and Planner
- Explorer
- Stress test against all 8 crisis scenarios, with full detail on one
- Planner
- Full detail on every stress test, breaking points, and your own saved tests